Common answers include:
- Drive better
- Make your car faster
So, how do we do it? To quote a certain basketball player: We’re talkin’ bout practice!
But, I don’t have a car to track. So, I live vicariously through my friends. How can I help them go faster? I can’t drive for them. But, I can help make their car faster. Virtual practice.
That’s how this all began — questions came up, and, because of the nature of my work, I had answers. Well, the past nature of my work.
From 2020 to 2025, I worked on aerodynamics Motorsports at GM: NASCAR, Indycar and then the Cadillac F1 program. My speciality was automating CFD workflows and generating high-fidelity 3D visuals for aerodynamic analysis. Before then, I had done CFD for the Cadillac Omega program (CT6), and the Michigan Solar Car Team. Then life intersected with opportunity, and I moved to California to work on autonomous flying taxis.
But once you’ve caught the speed itch, it never really leaves you. So what’s a sensible way to keep scratching it? Build a simulator, of course. And not just any simulator — one that’s accurate and blazing fast. Having confidence in accuracy is paramount.
In engineering, there’s often tension between hardware validation teams and simulation teams. But hardware validation and simulation aren’t opponents; they’re collaborators. Simulation exists to explore what’s too costly or impractical to test in real life. And the more accurate the simulation, the better it helps physical testing teams refine their craft.
Simulation without validation is worthless — pretty pictures without meaning. So, that brings me back to validation, and how to do it here. I don’t have a team of engineers to gather data for me. Luckily, a friend shared real track data. After that, I was in business and could start doing comparisons.
Doing this by hand with Excel and Matplotlib gets tedious fast. So I did what I do best: I built a dashboard. Now I could visualize what’s going on.
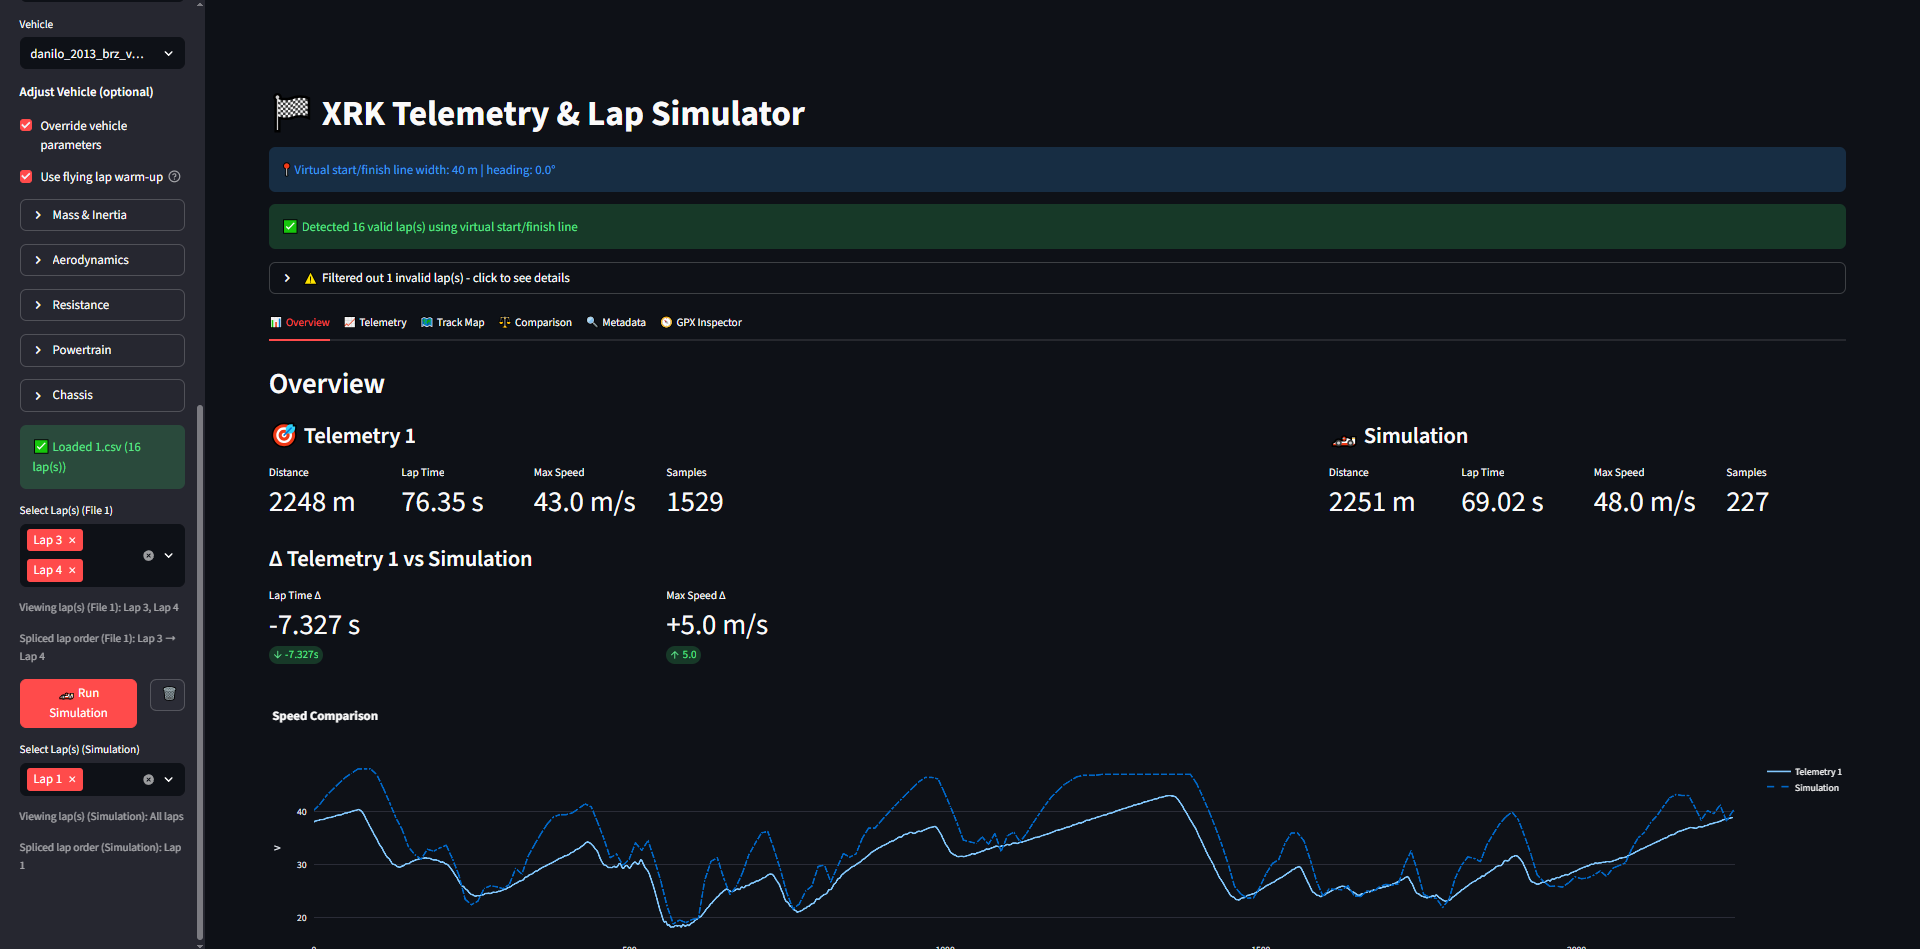
Now this nifty dashboard can overlay our data that we get from an actual race, with the simulated version of those same GPS points.
Looks like there are some major shape differences. Let’s see a good area to zoom into. The long straight on this track on the right would be good.
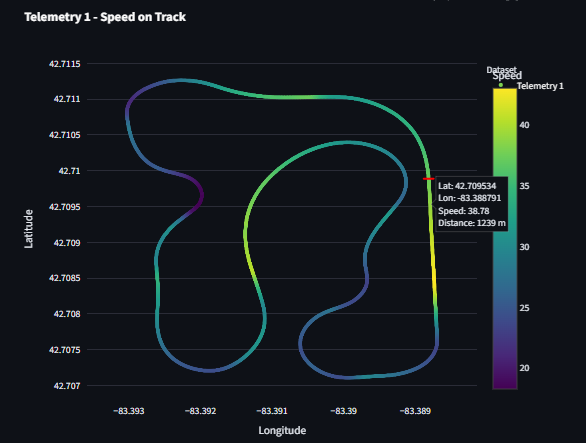
One major difference — let’s zoom in.
Ah! Big difference here, both in the velocity curve as well as acceleration. You can see the light blue is very linear.
Side tangent, going back to fundamentals and Newton:
Newton’s Second Law:
F = ma
Rearranged:
a = F / m
Where:
- a = acceleration
- F = force
- m = mass
What does this mean? It means that your acceleration — how fast you’re getting faster — is directly related to how much force you put on an object (in our case, how much our car is pushing forward).
Beyond that, it means that for a constant force you get a constant acceleration. Recall that acceleration is the derivative of velocity. What that means is that acceleration is measuring how fast you are changing in speed.
So if your acceleration is the same number, that means your velocity is changing at a constant rate. A straight line.
With our plotted curve, we see that the car’s velocity is increasing at a straight line, and also that acceleration is constant.
So our engine must be providing a steady amount of force!
Zooming back out, what other forces are on the car? There are things pushing us back, or resistive forces. Often, it’s not always the same resistive force, sometimes it is.
Forces acting on the car:
Forward (pushes you ahead):
- Engine — spinning the wheels, which push the car forward
Backward (holds you back):
- Rolling resistance — from the wheels, which depends on how heavy the car is
- Aerodynamic drag — depends on how fast you’re going
Your weight isn’t changing when you’re driving during this straight (unless you’re in a jet powered car) so that isn’t contributing to changing the shape of the curve.
Drag depends on how fast you are going. Not just that, but on the square (v²). The force holding you back from air increases massively the faster you get! But it doesn’t look like large aerodynamic forces are changing the shape of the curve as much as we’re predicting. To be sure, let’s check what forces the engine should deliver! Maybe the engine is producing more force faster we go.
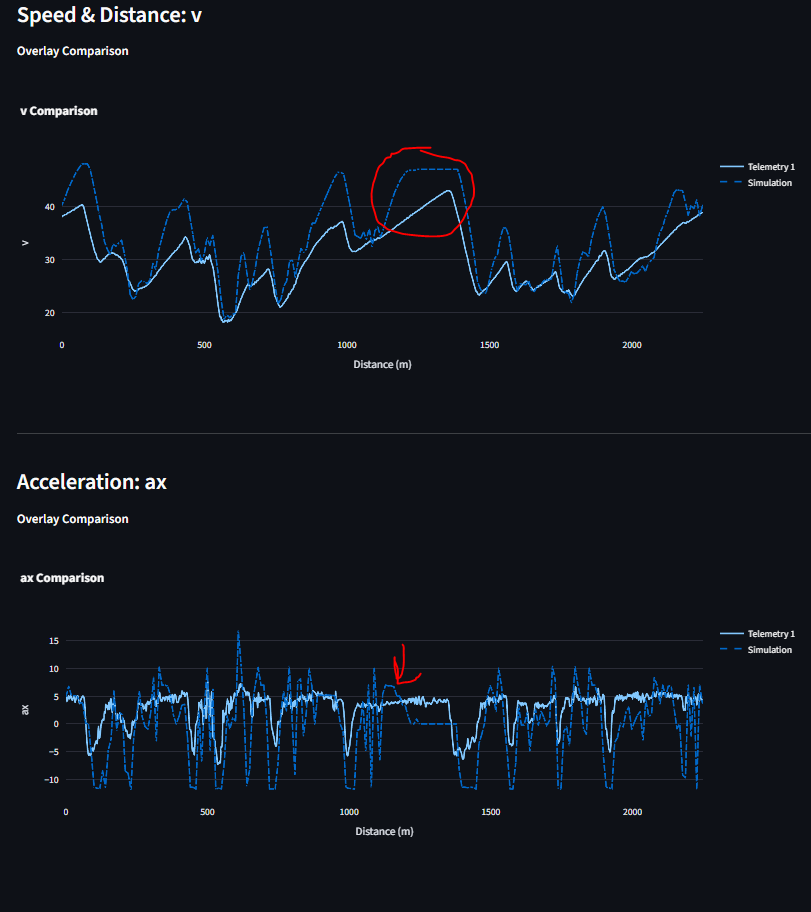
Let’s get to more plotting!
And what do we find? A torque (force) curve that’s relatively flat at RPM above 5000.
If we look at the track data, we can confirm that Rotations per Minute (RPM) for the actual vehicle itself is between 5000-7000.
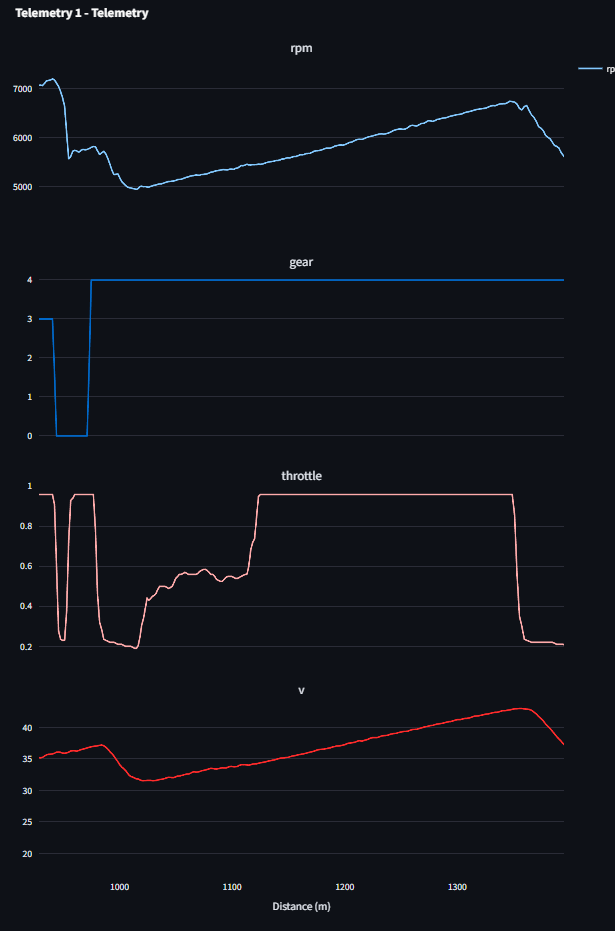
So, the discrepancy makes sense and points exactly to where the simulation can be refined.
That’s enough for today. Next time: improving the model.